Hey I'm David,
I am a researcher and software engineer interested in novel applications of data visualizations, agentic-systems, immersive analytics, AR/VR applications, and the tools we use to build them.
My Keywords:
Information Visualization, VR/AR Visualization, Immersive Analytics, Collaboration, Cross-Platform Interaction, Quantitative Methods Human Computer Interaction, User Centered Design, Detroit, TTRPGs, 3D Printing, Board Games, Red Pandas
Projects
Anu is an immersive data visualization toolkit built on Babylon.js and WebXR. Inspired by D3's data-binding patterns, Anu enables developers to create 3D and VR data visualizations through dynamic scene graph manipulation, pre-fabricated elements, and spatial interactions for web-based immersive analytics.
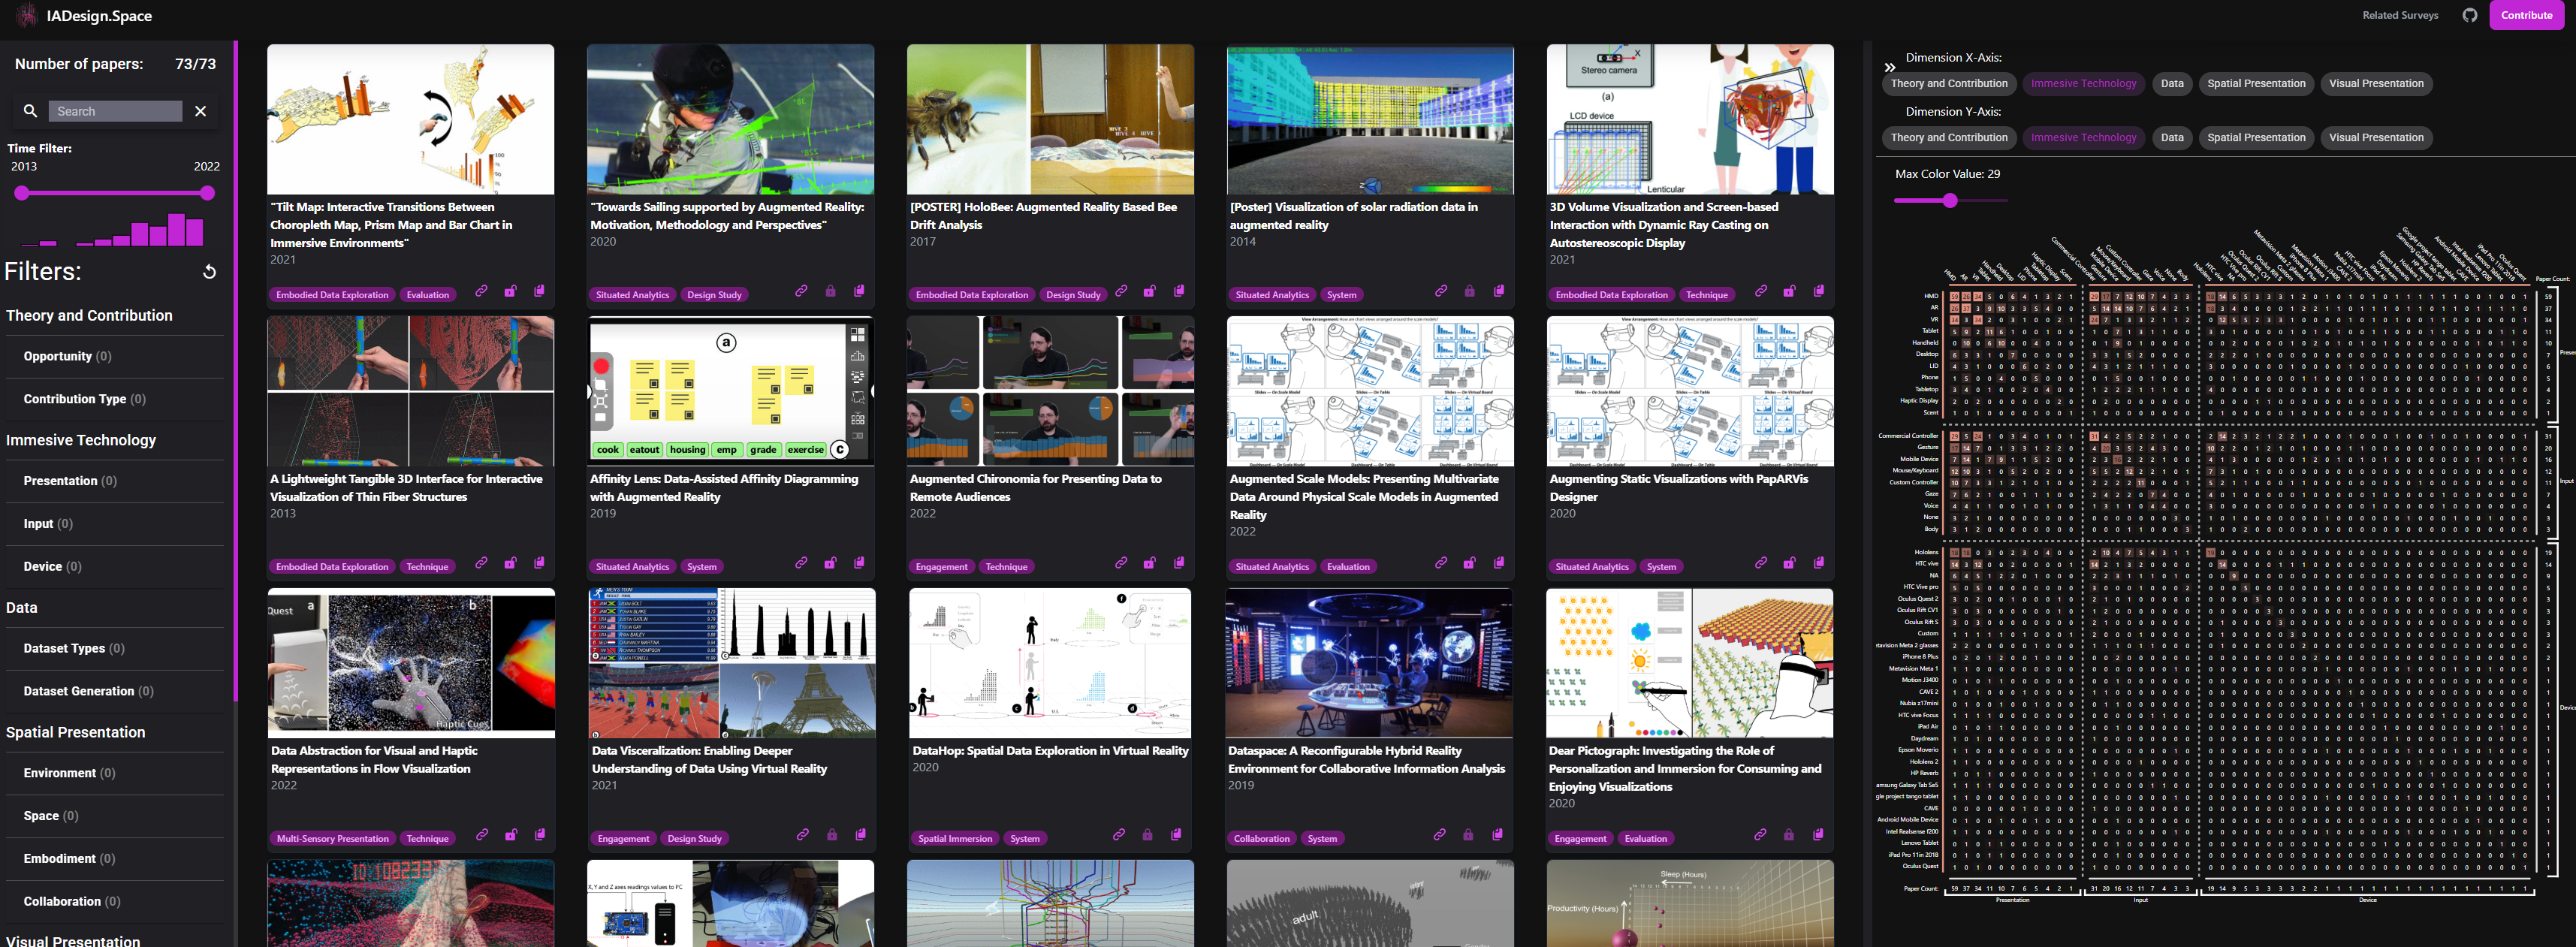
IADesign.Space is an interactive browser for exploring the immersive analytics design space. This comprehensive resource catalogs and organizes research papers across multiple dimensions including spatial presentation, visual presentation, immersive technologies, and contribution types to support researchers and practitioners in understanding the evolving landscape of immersive data visualization.
VRxD is a collaborative cross-platform (desktop and VR) immersive analytics prototype for interactive data visualization in virtual reality. The system features advanced interaction sharing capabilities, enabling collaborative exploration of multi-dimensional datasets through coordinated views including strike zone visualizations, pitch trajectory analysis, and 3D spatial representations.
Visconnect is a framework for adding p2p synchnronous collaberation to new or existing web-based visualizations. Events, such as clicking, dragging, and brushing, are synchronized across collaborators. Visconnect also supports synchronization of custom events to enable custom collaborative interactions.
Data Comets is an interactive PX4 flight log analysis tool. With Data Comets, you can encode flight data onto the flight path, filter and brush the data by time, and much more! This tool was developed to help UAV developers and operators analyze their autonomous aerial vehicle system data.
NETRD Explorer is an interactive tool for exploring the functionality of the NETRD library. NETRD is a python library for reconstructing networks from timeseries. With this tool you can explore several of the implemented methods and compare the results.
GeoSocialVis, an interactive visualization tool for social network analyses with a focus on displaying the geosocial co-authorship network. GeoSocialVis uses a novel force layout that strikes a user-defined balance between showing network topology and the geographic locations of the nodes.